Similar Chart Search Results

※ Update Date : 2025-04-28
Bioneer Corp (064550)
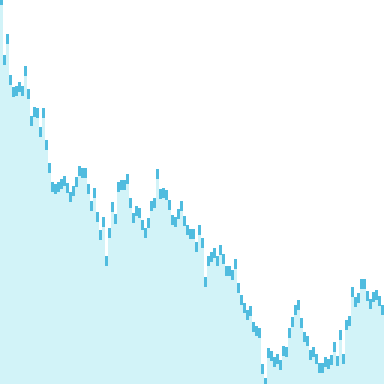
Future Trends from 50 Similar Past Charts
16-Trading Day Comparison : 10
32-Trading Day Comparison : 10
64-Trading Day Comparison : 10
128-Trading Day Comparison : 10

Average Future Change of Similar Charts : 0.34% ▲
Chart Score
Similar past charts show a balanced ratio of rises and drops.
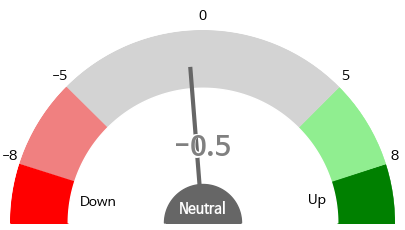
Score : 0.34 X 0.7 + (46.0 - 50) X 0.2 + (0.1) = -0.5
Rising Ratio After 10 Days Score 6 or more : 56.42 %
>> View Detailed Probability by Score Range

of Similar Charts
0.34% ▲

(23/50)
46.0%
Past performance is not indicative of future results. All investment decisions should be made by the investor at their own risk.
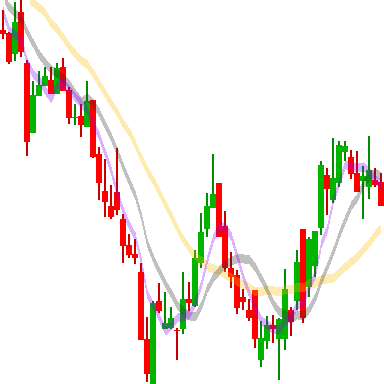
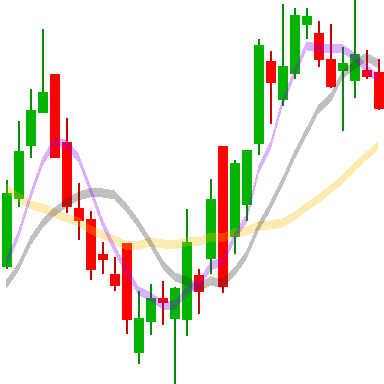
Detailed Comparison
Rising Stock : 3 / 10
Rising Stock : 5 / 10
Rising Stock : 4 / 10
Rising Stock : 6 / 10
Rising Stock : 5 / 10
Click on the chart image to see similar charts.
| Related Stocks | ||||
|---|---|---|---|---|
| HLB | PharmaResearch | Seegene, Inc. | ||
| HLB Life Science Co Ltd | 티앤엘 | 바이오노트 | ||
| 바디텍메드 | JETEMA, | 나이벡 | ||