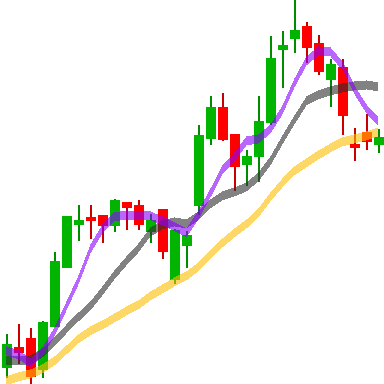
Similar Chart Finder
NYSE & NASDAQ
Supported stocks will appear in the autocomplete list when you enter text.
It supports the top 2000 stocks listed NYSE and Nasdaq, exploring all charts from the last 10 years.
It supports comparison for 8, 16, 32, 64, and 128 trading days.
All latest data will be updated everyday within 3 hours after the market closes.
Only stocks are supported; ETFs and ETNs are not supported.
※ Latest Update Date : 2026-07-16
2026-07-16
Market Sentiment
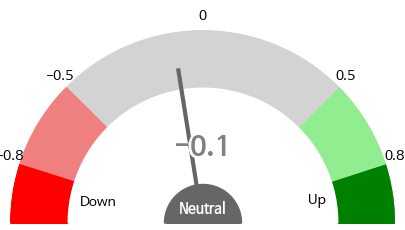
Average Score for All Stocks : -0.1
| Item Name | Future Average Change | Rising Chart Rate |
|---|---|---|
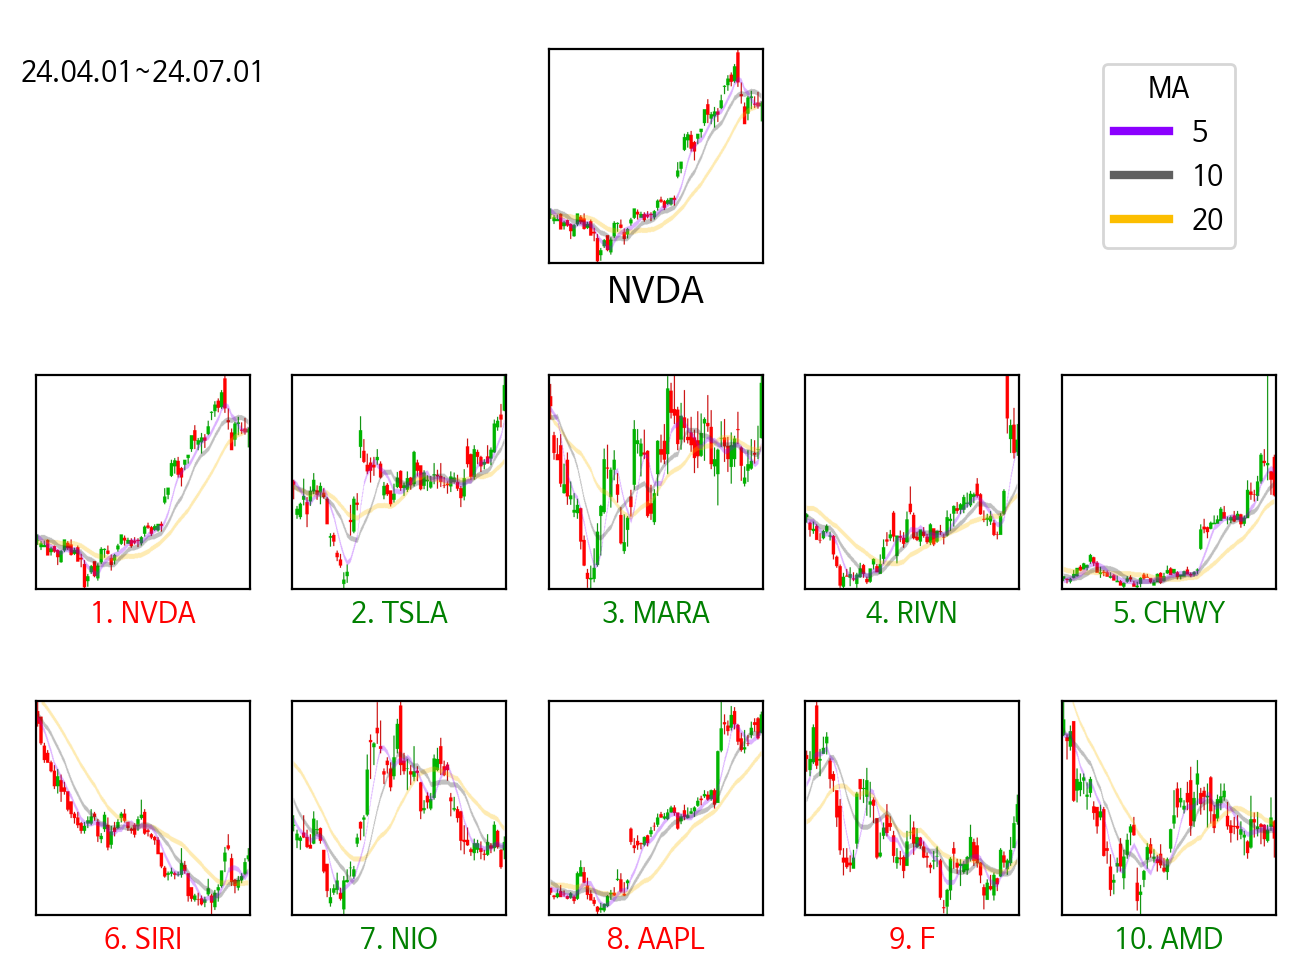
| 1. NVIDIA Corp | -0.72% ▼ | 48% |
| 2. Taiwan Semiconductor Manufacturing Co Ltd ADR | -0.15% ▼ | 56% |
| 3. Apple Inc | 0.39% ▲ | 56% |
| 4. Eli Lilly and Co | 0.45% ▲ | 57% |
| 5. JPMorgan Chase & Co | -0.09% ▼ | 48% |
| 6. Microsoft Corp | 0.65% ▲ | 60% |
| 7. Amazon.com Inc | -1.34% ▼ | 54% |
| 8. Visa Inc | -0.89% ▼ | 44% |
| 9. Alphabet Inc Class A | 0.79% ▲ | 56% |
| 10. Exxonmobil Holdings Corp | 0.86% ▲ | 57% |
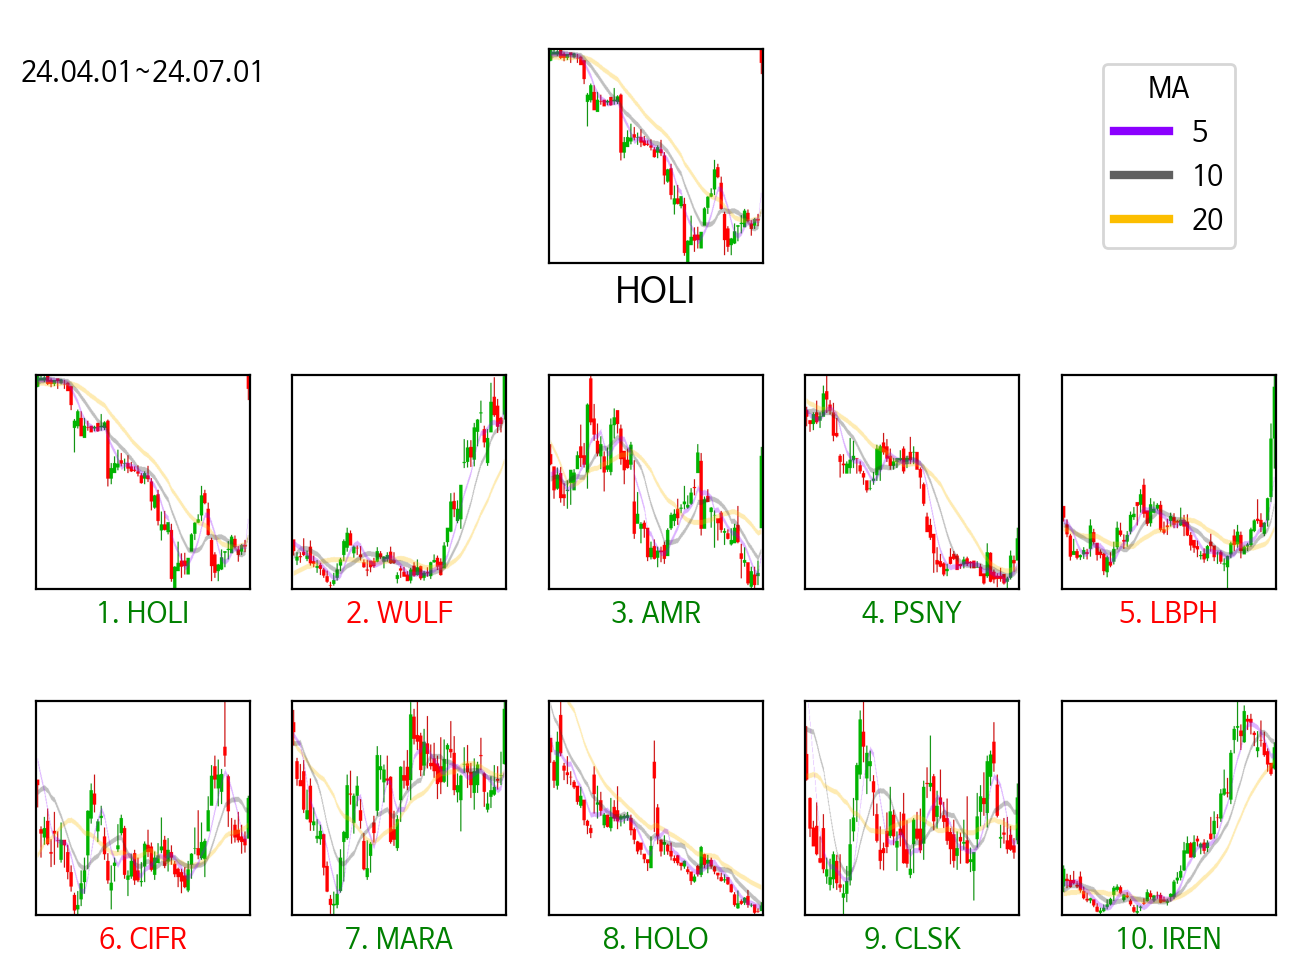
| 1. CareDx Inc | 1.1% ▲ | 46% |
| 2. AtaiBeckley Inc | 3.41% ▲ | 54% |
| 3. Maase Inc | -0.21% ▼ | 42% |
| 4. Distribution Solutions Group Inc | 4.82% ▲ | 66% |
| 5. Karooooo Ltd | 1.13% ▲ | 54% |
| 6. Abbott Laboratories | 2.13% ▲ | 57% |
| 7. Lucid Group Inc | 1.58% ▲ | 61% |
| 8. GH Research PLC | 0.5% ▲ | 56% |
| 9. J B Hunt Transport Services Inc | -0.17% ▼ | 46% |
| 10. Hub Group Inc | 0.22% ▲ | 52% |
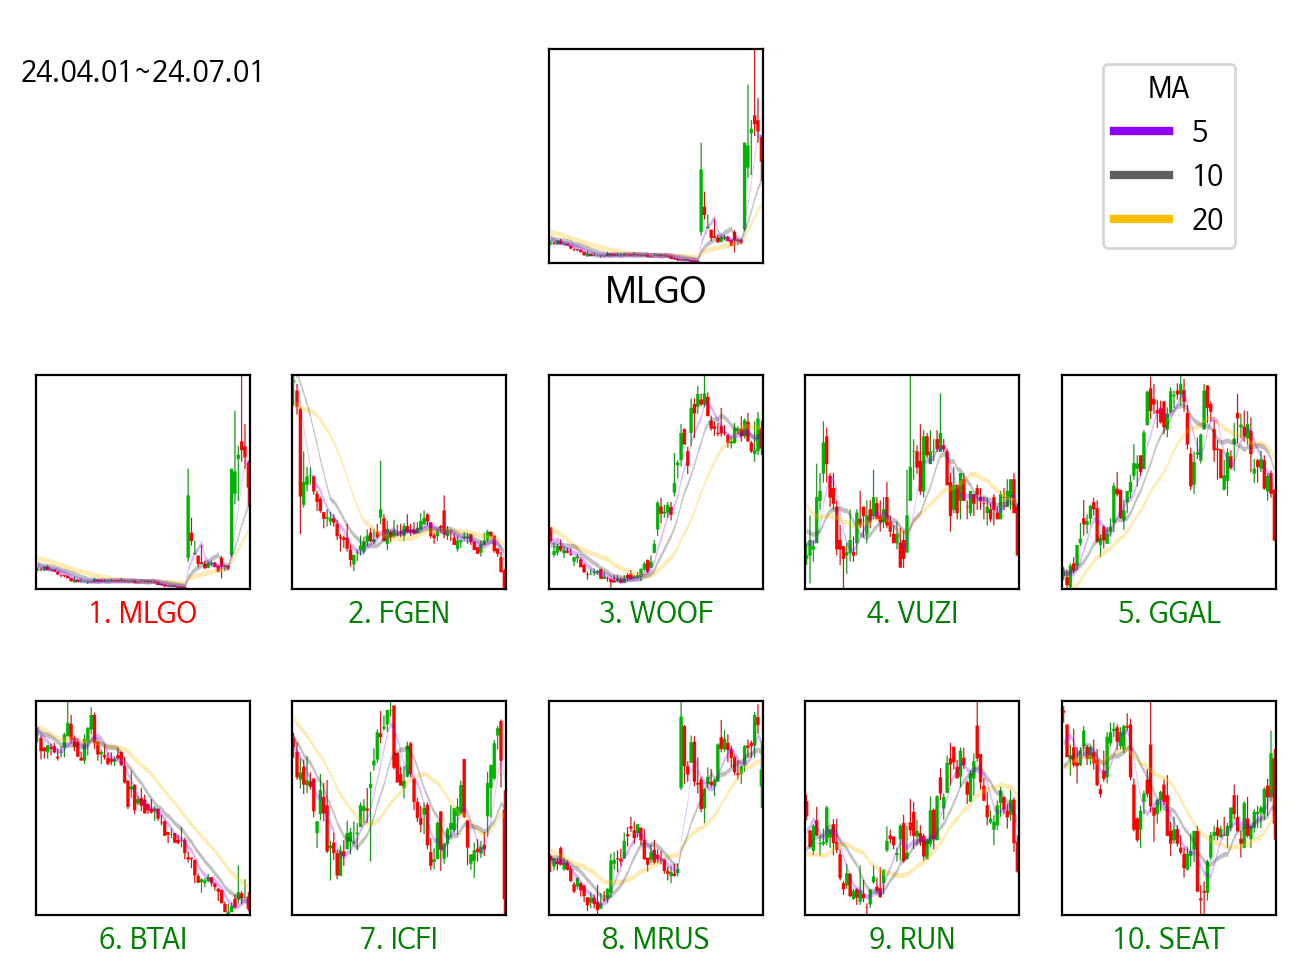
| 1. AST SpaceMobile Inc | -2.37% ▼ | 46% |
| 2. Maxlinear Inc | 1.71% ▲ | 62% |
| 3. Absci Corp | 0.68% ▲ | 60% |
| 4. Fuelcell Energy Inc | -2.03% ▼ | 44% |
| 5. AXT Inc | -0.48% ▼ | 57% |
| 6. BlackBerry Ltd | 0.73% ▲ | 46% |
| 7. Nebius Group NV | 1.2% ▲ | 60% |
| 8. Bloom Energy Corp | 1.97% ▲ | 68% |
| 9. Purecycle Technologies Inc | 0.02% ▲ | 52% |
| 10. Chronoscale Corp | 3.08% ▲ | 68% |
※ Future Average Change : Average future change of similar charts
※ Rising Chart Rate : Rate of similar charts that rise in the future