Android app release
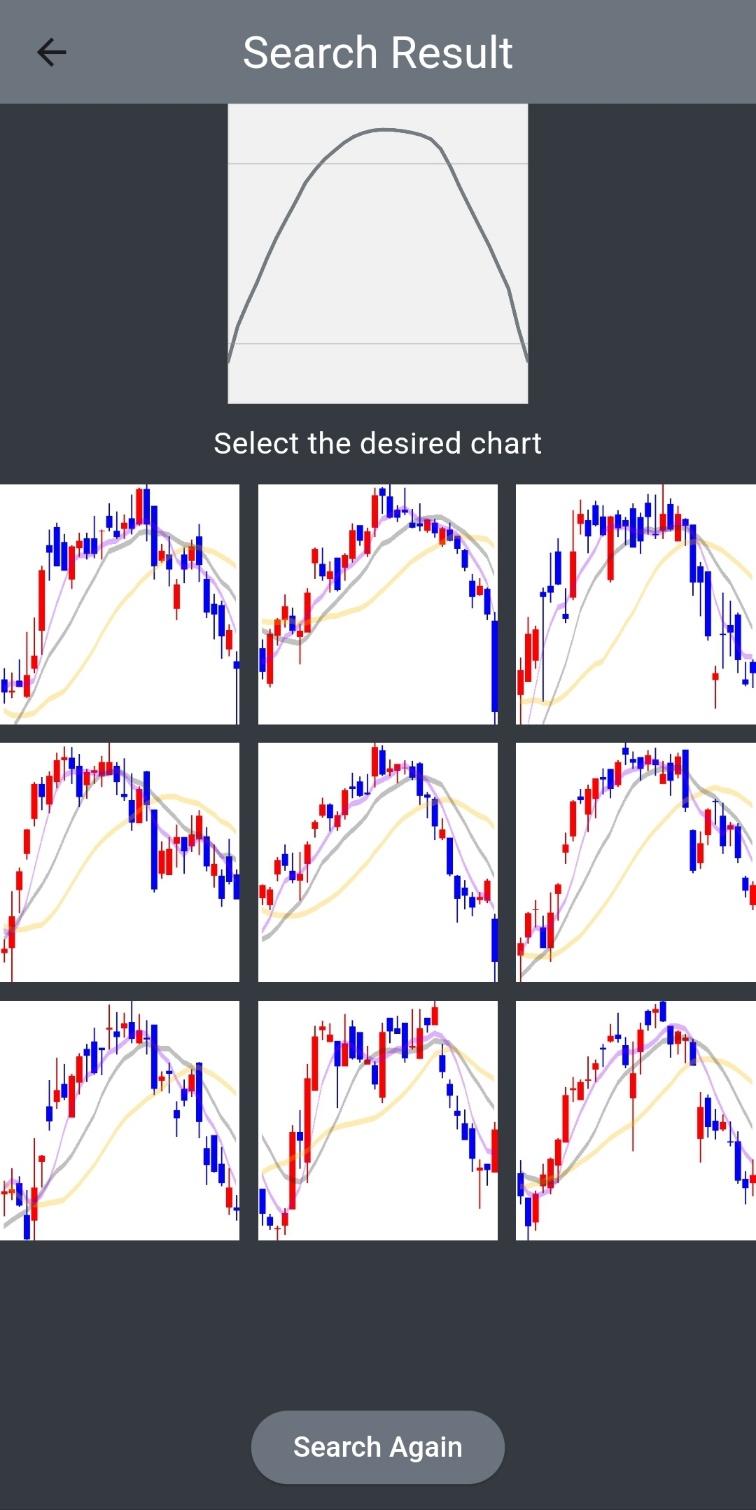
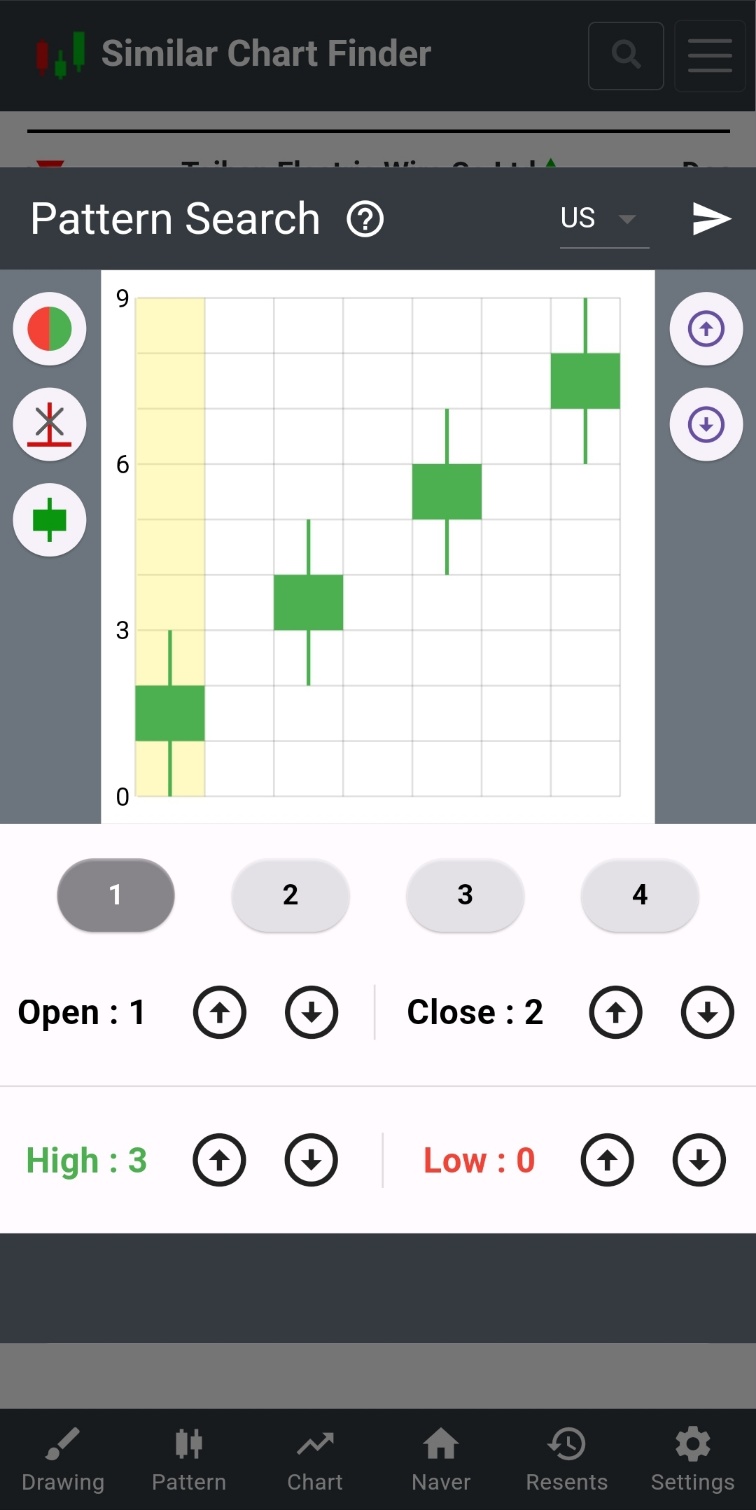
※ Drawing search, Candle Pattern Search support
→ Try drawing the chart you want yourself!
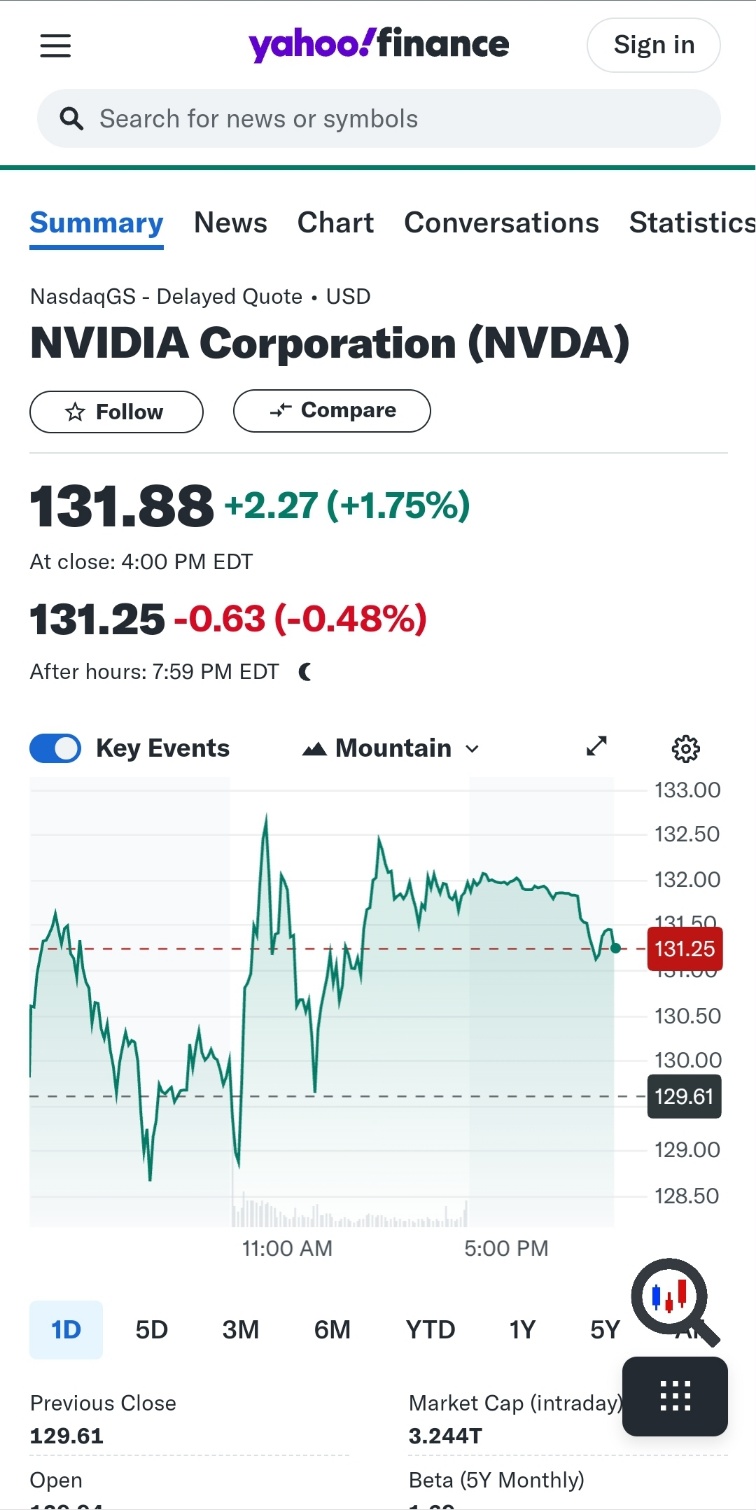
※ Check out similar charts with Yahoo Finance!
>> Download the App
Android app release
※ Drawing search, Candle Pattern Search support
→ Try drawing the chart you want yourself!
※ Check out similar charts with Yahoo Finance!
>> Download the App
Browse all charts for the last 10 years for all stocks.
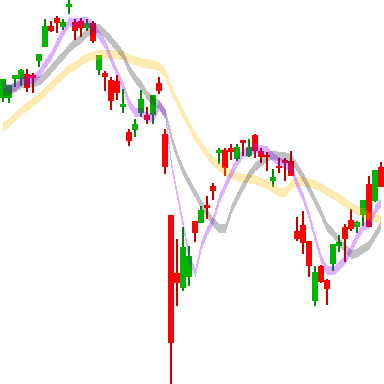
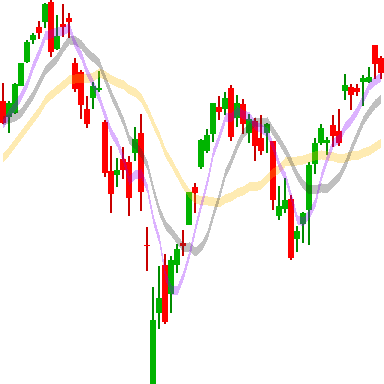
The expert says, 'This chart is ascending.' Is it really so?
What happens to the charts with price limits, gaps, upper tails, and so on?
What happens to the charts that have supported the 20-day line?
What happens to the chart that has risen/fallen for 8 consecutive times?
Let's find the most similar chart among millions of charts.
Recently, the importance of chart analysis has been growing as algorithmic trading using charts has increased.
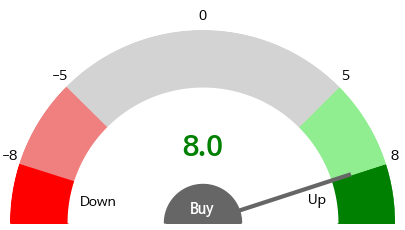
Each stock has a chart score, and the more frequently similar charts show upward trends, the higher the score.
We consider everything from a long-term perspective of about 6 months to a short-term perspective of 8 trading days.
Validation results show that when similar charts frequently indicate future upward trends, the actual probability of a rise is higher.
Is my stock's chart really a rising chart?

Similar Chart Finder App Released!