NVIDIA Corp
Apple Inc
Sirius XM Holdings Inc
Tesla Inc
Palantir Technologies Inc
Advanced Micro Devices Inc
Marathon Digital Holdings Inc
Amazon.com Inc
Intel Corp
Micron Technology Inc
NVIDIA Corp
Apple Inc
Sirius XM Holdings Inc
Tesla Inc
Palantir Technologies Inc
Advanced Micro Devices Inc
Marathon Digital Holdings Inc
Amazon.com Inc
Intel Corp
Micron Technology Inc
NVIDIA Corp
Apple Inc
Sirius XM Holdings Inc
Tesla Inc
Palantir Technologies Inc
Advanced Micro Devices Inc
Marathon Digital Holdings Inc
Amazon.com Inc
Intel Corp
Micron Technology Inc
NVIDIA Corp
Apple Inc
Sirius XM Holdings Inc
Tesla Inc
Palantir Technologies Inc
Advanced Micro Devices Inc
Marathon Digital Holdings Inc
Amazon.com Inc
Intel Corp
Micron Technology Inc
NVIDIA Corp
Apple Inc
Sirius XM Holdings Inc
Tesla Inc
Palantir Technologies Inc
Advanced Micro Devices Inc
Marathon Digital Holdings Inc
Amazon.com Inc
Intel Corp
Micron Technology Inc
NVIDIA Corp
Apple Inc
Sirius XM Holdings Inc
Tesla Inc
Palantir Technologies Inc
Advanced Micro Devices Inc
Marathon Digital Holdings Inc
Amazon.com Inc
Intel Corp
Micron Technology Inc
NVIDIA Corp
Apple Inc
Sirius XM Holdings Inc
Tesla Inc
Palantir Technologies Inc
Advanced Micro Devices Inc
Marathon Digital Holdings Inc
Amazon.com Inc
Intel Corp
Micron Technology Inc
NVIDIA Corp
Apple Inc
Sirius XM Holdings Inc
Tesla Inc
Palantir Technologies Inc
Advanced Micro Devices Inc
Marathon Digital Holdings Inc
Amazon.com Inc
Intel Corp
Micron Technology Inc
NVIDIA Corp
Apple Inc
Sirius XM Holdings Inc
Tesla Inc
Palantir Technologies Inc
Advanced Micro Devices Inc
Marathon Digital Holdings Inc
Amazon.com Inc
Intel Corp
Micron Technology Inc
NVIDIA Corp
Apple Inc
Sirius XM Holdings Inc
Tesla Inc
Palantir Technologies Inc
Advanced Micro Devices Inc
Marathon Digital Holdings Inc
Amazon.com Inc
Intel Corp
Micron Technology Inc
badge
Similar Chart Finder

Android app release


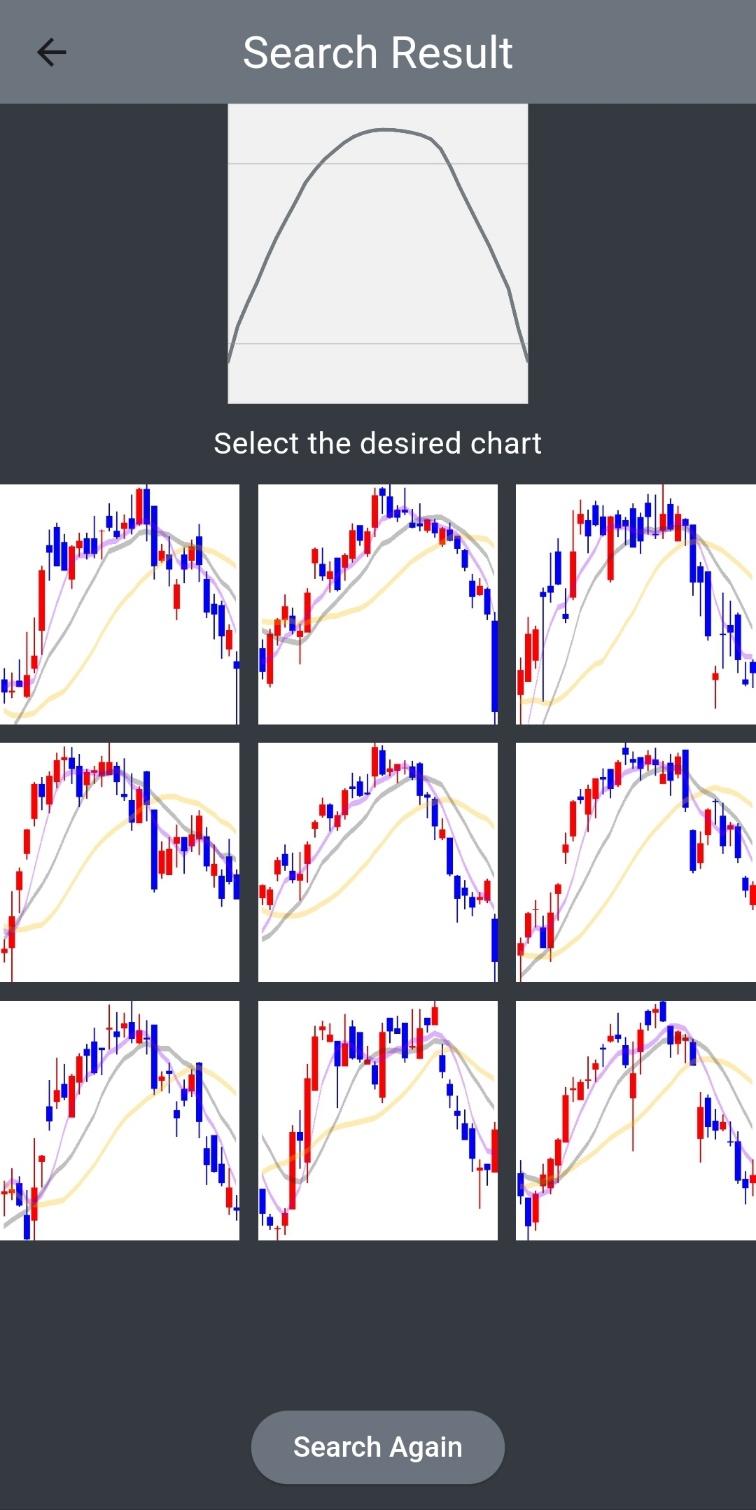
Drawing search, Candle Pattern Search support
→ Try drawing the chart you want yourself!

※ Check out similar charts with Yahoo Finance!

>> Download the App

logo
Stock Price Prediction Project

Similar Chart Finder

KOSPI
kospi
Search
Korean Market
NASDAQ
nasdaq
Search
US Market

Browse all charts for the last 10 years for all stocks.


The expert says, 'This chart is ascending.' Is it really so?

What happens to the charts with price limits, gaps, upper tails, and so on?

What happens to the charts that have supported the 20-day line?

What happens to the chart that has risen/fallen for 8 consecutive times?


Let's find the most similar chart among millions of charts.


Indispensable indicator for stock trading.

The origin of the stock prediction AI that learns from past similar charts.

Recently, the importance of chart analysis has been growing as algorithmic trading using charts has increased.
삼영엠텍
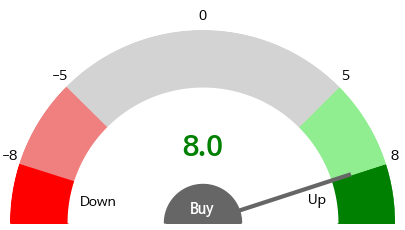
Chart Evaluation ?
Rising Ratio After 10 Days
Score -4 or less : 41.89 % Score 6 or more : 67.03 %
>> View Detailed Probability by Score Range

We evaluate future trends based on similar historical charts.

We consider everything from a long-term perspective of about 6 months to a short-term perspective of 8 trading days.


According to the actual validation results, similar charts showing an upward trend also have a higher actual probability of rising.

>> Check Validation Results


Is my stock's chart really a rising chart?


badge
Secrets to Consistently Staying
in the Top 5% of Gains


Similar Chart Finder App Released!
app_img1
Drawing Search Support
app_img2
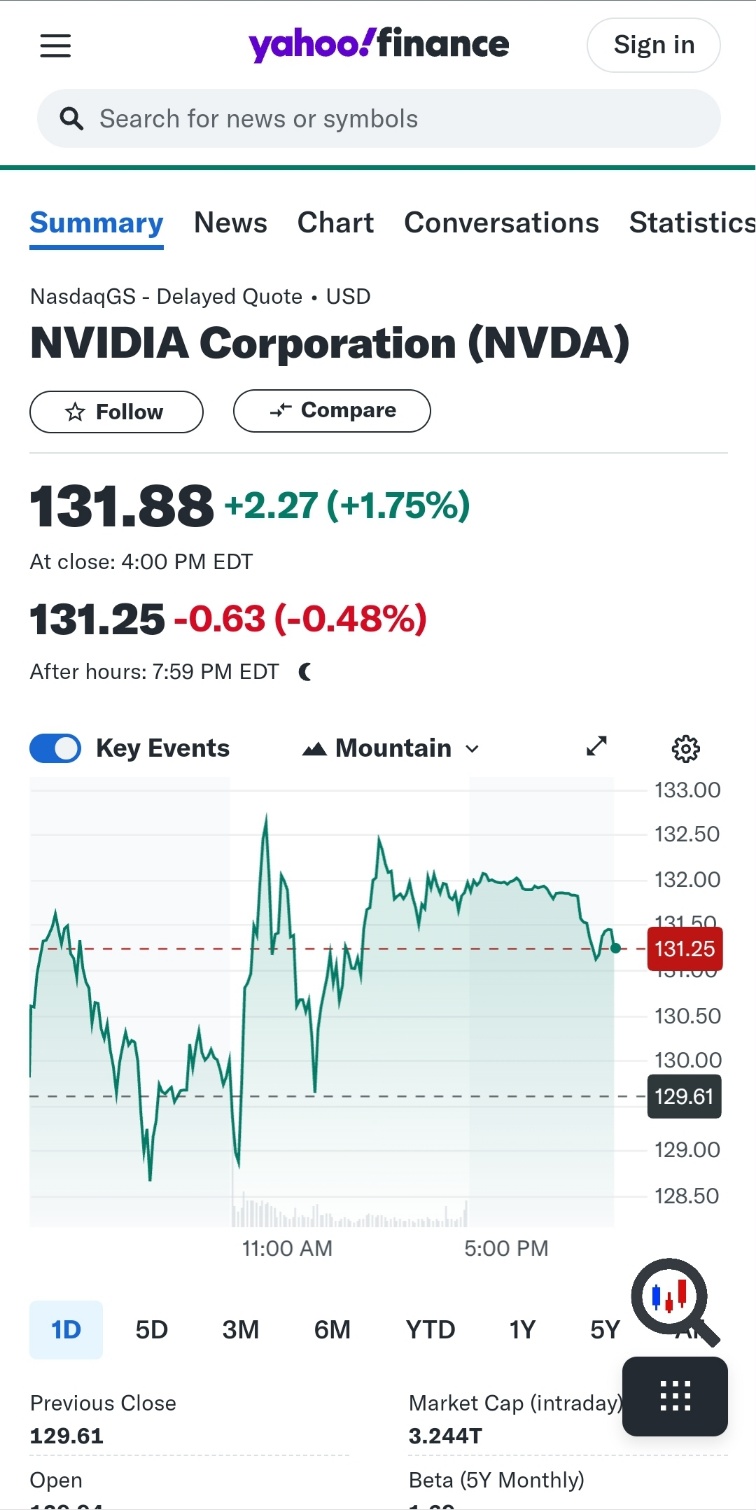
Yahoo Finance Integration
app_img3
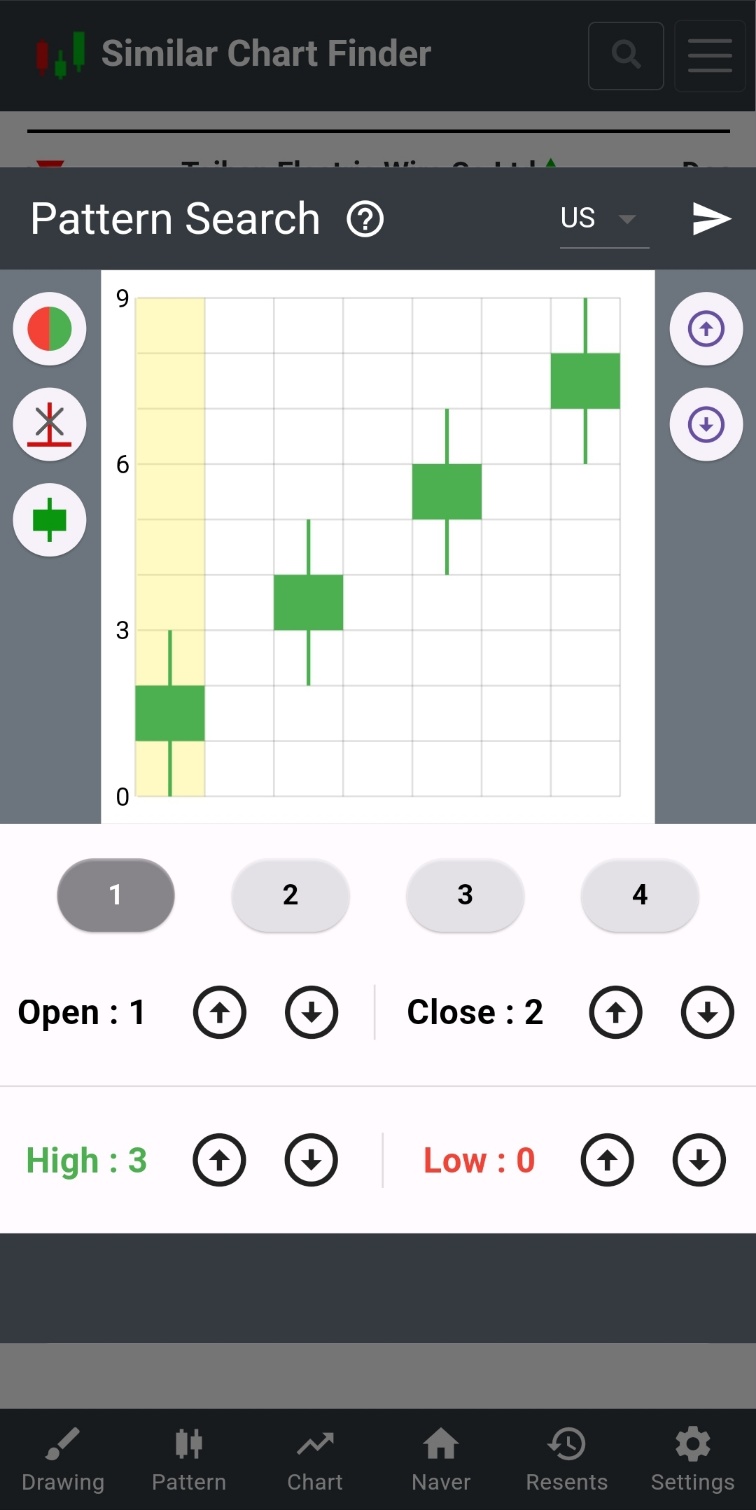
Candle Pattern Search Support

See Similar Charts in App
Drawing Search Support & Yahoo Finance Integration
Candle Pattern Search Support & Support for Stock Favorites